
Overview
Nave is a kanban analytics platform for agile teams. The company has launched AI-powered insights. Nave states that its analytics are used by more than 7,000 agile teams worldwide and names Syngenta, Ramsey Solutions, The Economist, Holcim, Doodle, Nubank and ArcTouch among its customers. Pricing is $100 per board per month or $1,000 per board per year with unlimited users and a 14-day free trial. The platform is SOC 2 compliant as of May 2024 and GDPR compliant. The Kanban Analytics app on the Atlassian Marketplace has more than 1,000 installs and a 4.4 out of 5 rating from 33 reviews. Nave was named Atlassian Marketplace Rising Star Partner of the Year 2026, announced at Team '26 in Anaheim. Its newsletter has more than 60,000 subscribers. The company describes itself as a small team. Founder and CEO Sonya Siderova is based in the Antwerp area; the company's Atlassian Marketplace vendor address is in Sofia, Bulgaria, and its contact phone number is Belgian.
Stated facts & numbers
- Headquarters: Antwerp (founder location); vendor address in Sofia, Bulgaria
- Founder & CEO: Sonya Siderova
- Product: Kanban analytics for Jira, Azure DevOps, Trello, Asana
- Customers: 7,000+ agile teams; Syngenta, Ramsey Solutions, The Economist, Holcim, Doodle, Nubank, ArcTouch
- Pricing: $100 per board per month, unlimited users
- Award: Atlassian Marketplace Rising Star Partner of the Year 2026
- Compliance: SOC 2 (May 2024), GDPR
Leadership & org chart


In the news
- The fact that probabilistic forecasts are based on your past performance data doesn’t mean that you need a ton of data in order to come up with reliable delivery predictions. Whether you have been collecting data from the very beginning of your board creation, or you are just getting started with new teams is beside the point. The main prerequisite of producing reliable forecasts is to maintain a stable system. If your delivery workflow is optimized for predictability, you will need 20 to 30 completed items to come up with accurate
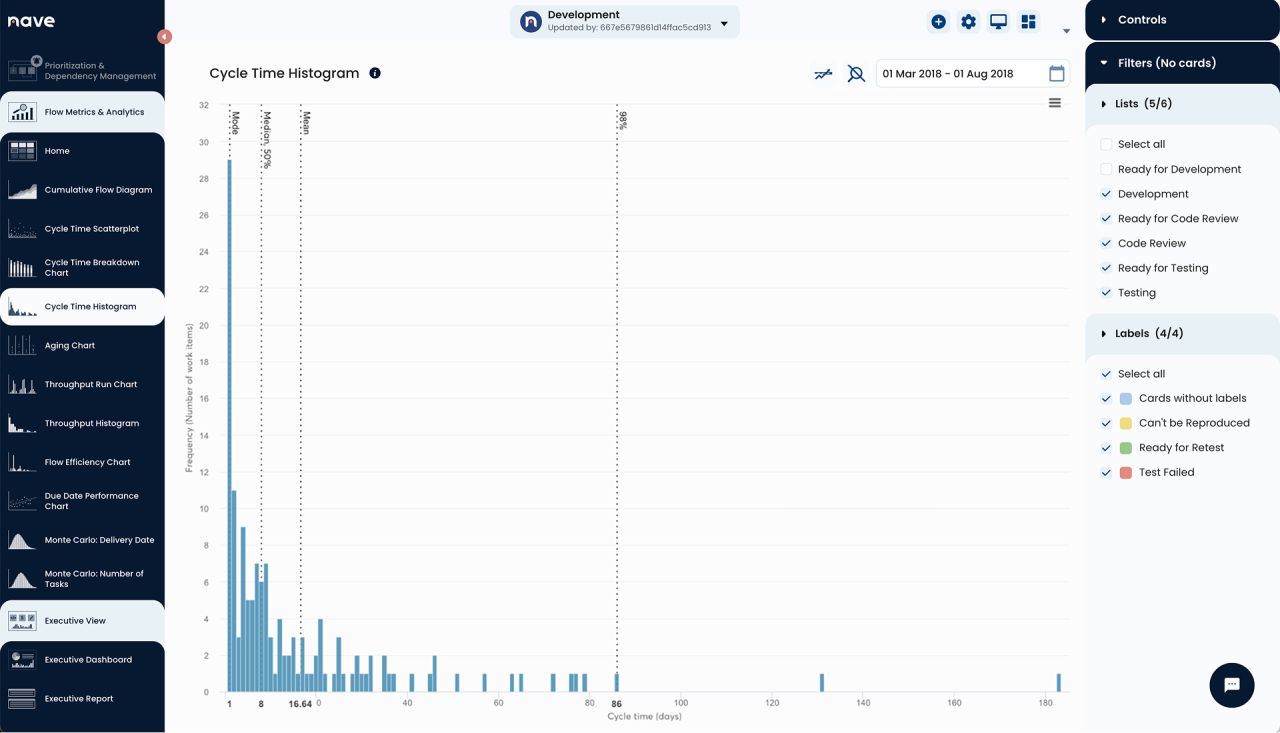
- The dotted vertical lines stretching across the Cycle Time Histogram are called percentile lines. We use percentiles to establish service level agreements and define the probability of meeting our commitments. Using the percentiles on your Cycle Time Histogram, you can perform a probabilistic forecast. Essentially you define a range of cycle times and the probability that comes with each of them. Now, what happens if a customer asks “When will this be done”? Looking into the histogram here, the answer will be “there is a 50/50
- Walk your prototype forward. Does it produce a cycle time today? It does. Will it produce the same cycle time after the next board change? Only if someone notices the change, re-decides the rules, and retests them. Is that someone's name written down anywhere? In most organizations, no. And a rule nobody re-owns after every board change is a number nobody should plan around -> https://getnave.co/4AeWNSF

- Zoran Vujkov noticed something strange in the data. His teams were good at prioritizing work while it was being developed. Then the work reached code review. And somehow, those priorities disappeared. Zoran is an Agile Coach at United Cloud, working in an environment of more than 30 teams. While analyzing flow efficiency in Nave, he spotted the gap. As he put it: "We're really good at nailing down our priorities during development, there's a bit of a blind spot when it comes to code review." He could have stopped at "code review

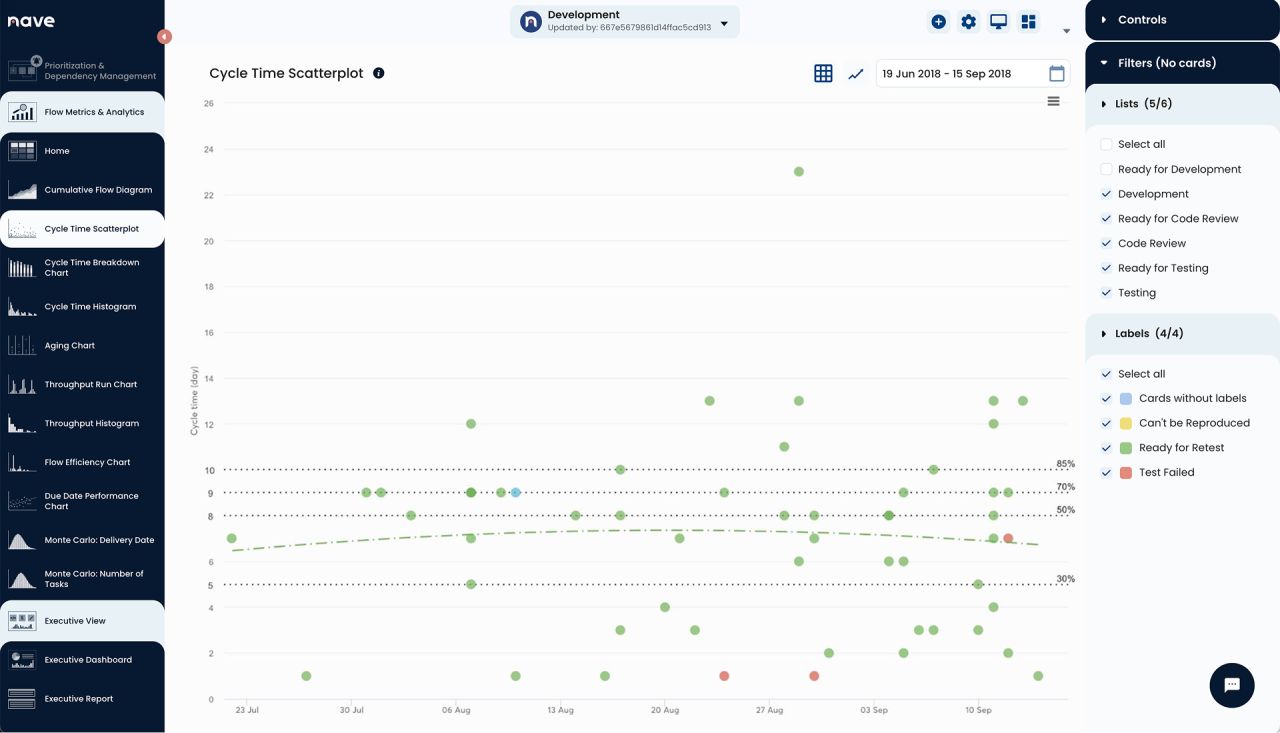
- How quickly is your team actually capable of delivering results? The best way to answer this question is to analyze your performance. When it comes to cycle time analysis, the Cycle Time Scatterplot is an essential tool to have on hand. This chart visualizes all your completed tasks as dots scattered on a plot. Each task comes with the finished date and the time it has taken to complete. The horizontal dotted lines stretching across the graph are called percentile lines. We use percentiles to understand how much time we need to
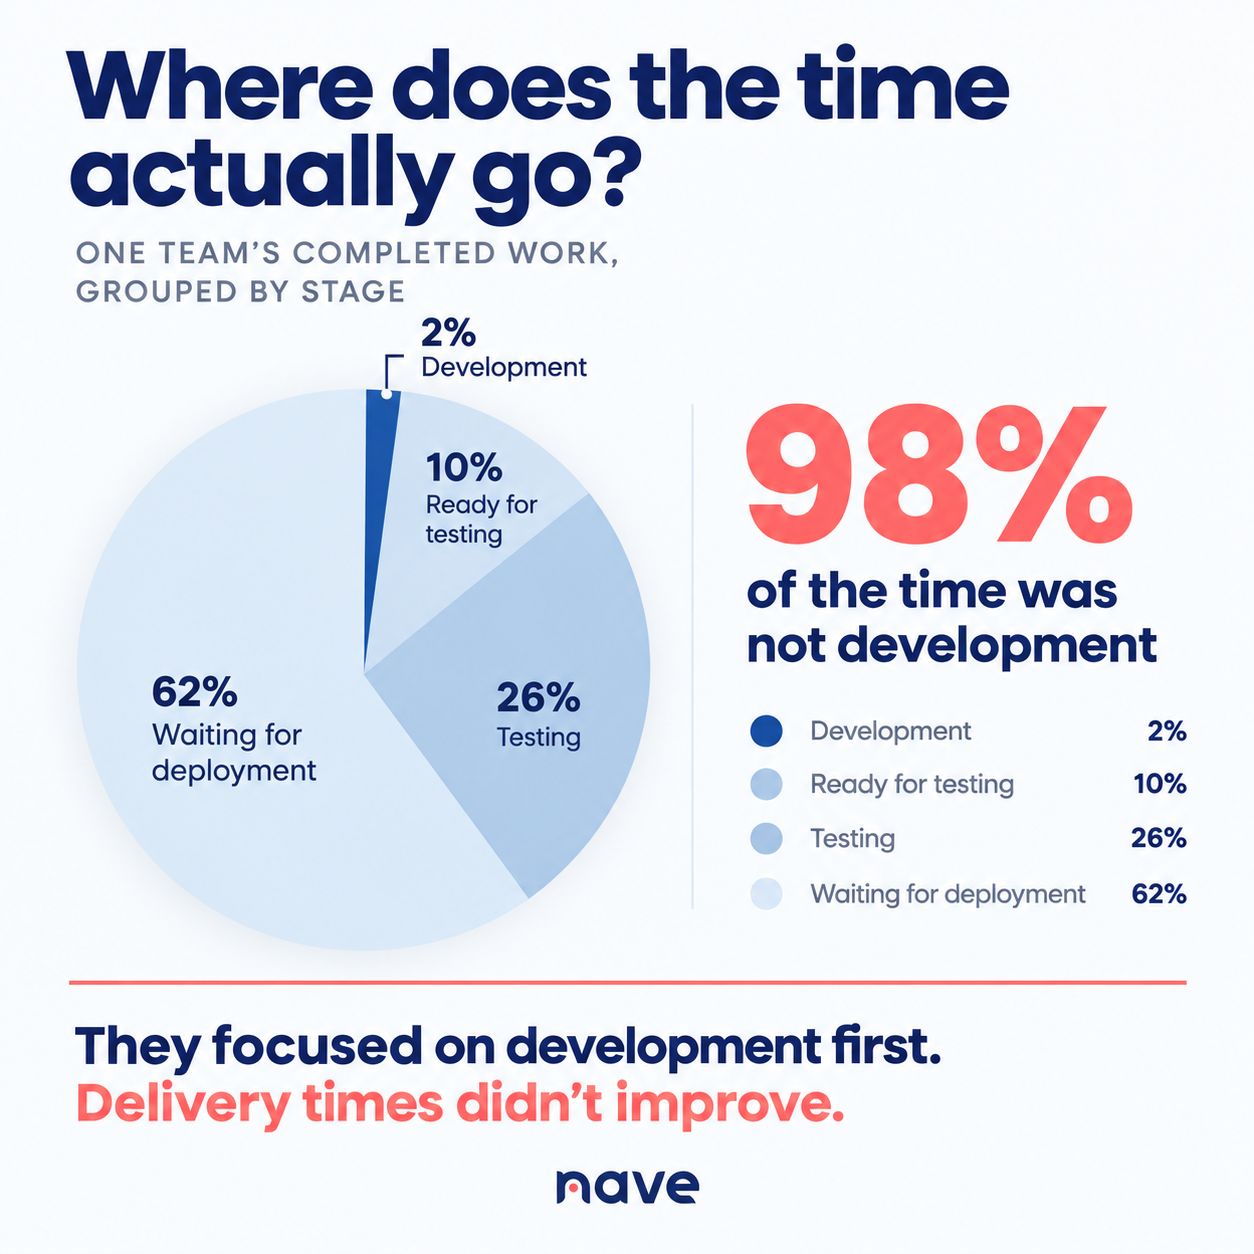
- Leadership tells you engineering is the bottleneck. They want you to help make development faster. What do you do? I wouldn’t argue with them. I also wouldn’t start fixing engineering. I’d test the assumption first. I can ask one question: “Take our completed work this quarter and tell me which stage the time actually went to.” I ran exactly that analysis on one of our Development boards. using Clause and the Nave MCP. Development never exceeded 2%. It was waiting for Deployment that represented 62% of the total delivery time.
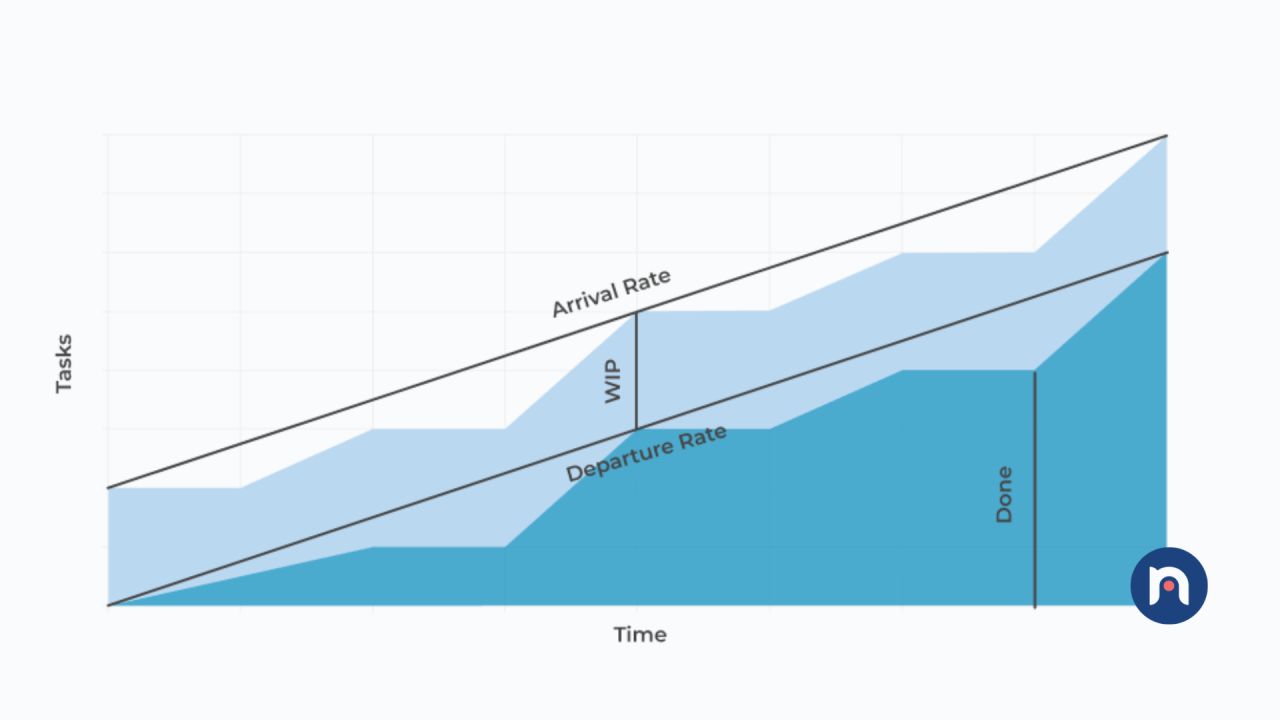
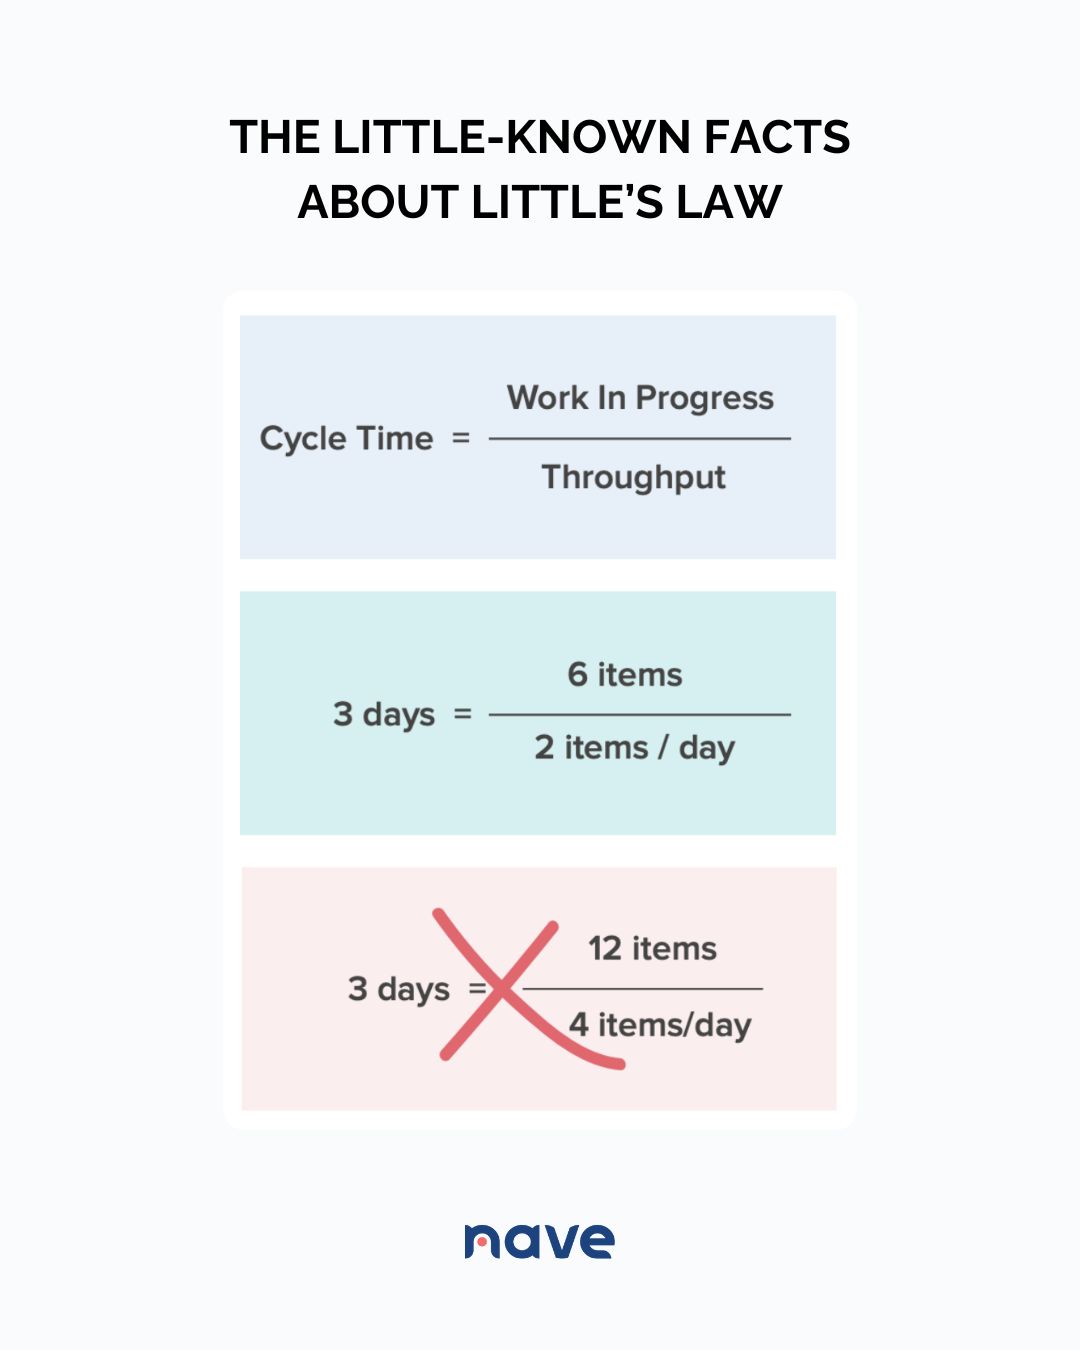
- Most people would argue that the true value of Little’s Law lies in being able to make predictions in the future. So the question is, does the law serve this purpose? Let’s look into the following example. Let’s say you have an average WIP of 6 items and an average throughput of 2 items per day. This configuration gives your team an average cycle time of 3 days. What happens if we raise our WIP? The fact is, you cannot say that if you increase the average WIP to 12 tasks and keep the average cycle time constant of 3 days, then your
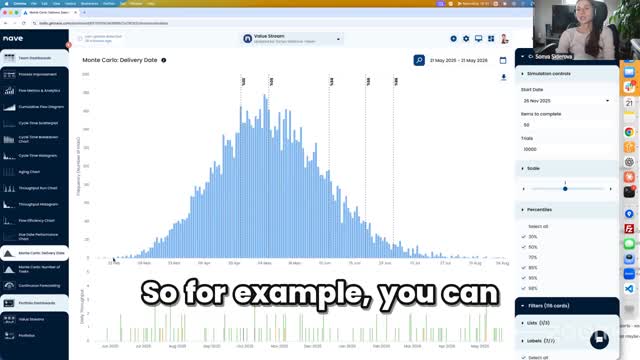
- Antony told me his team had delivered 85% of what they committed to in Q1. That’s a strong result. He attributed it to being ruthless about prioritization. Later in the conversation, I opened a forecast and showed him another piece of evidence I would want before making the next quarterly commitment: what has this team actually demonstrated that it can finish? The delivery history gave us a range of outcomes, each with a different probability. And that immediately gave him a threshold to work with. If the next quarterly plan

Something wrong or missing? Send an update. Fixed within 24 hours.