📊 One KPI, three definitions: why your board meeting turns into a debate about numbers
Picture a monthly finance review. Sales reports revenue of €4.2M. Finance reports €3.9M. The Power BI dashboard says €4.05M. Nobody is wrong; they are simply using three different definitions. Forty minutes later, the meeting is about reconciling figures instead of making decisions.
This is a KPI governance problem, not a dashboard problem. No amount of visual polish fixes it.
Here is how we approach it at Vizlake:
🔸 Write a one-page KPI definition for each metric. Name, business owner, formula, source system, filters, refresh frequency. If it does not fit on one page, it is not defined yet.
🔸 Assign a single owner per KPI. Not a committee. One person who can say "this is the definition" and is accountable when it changes.
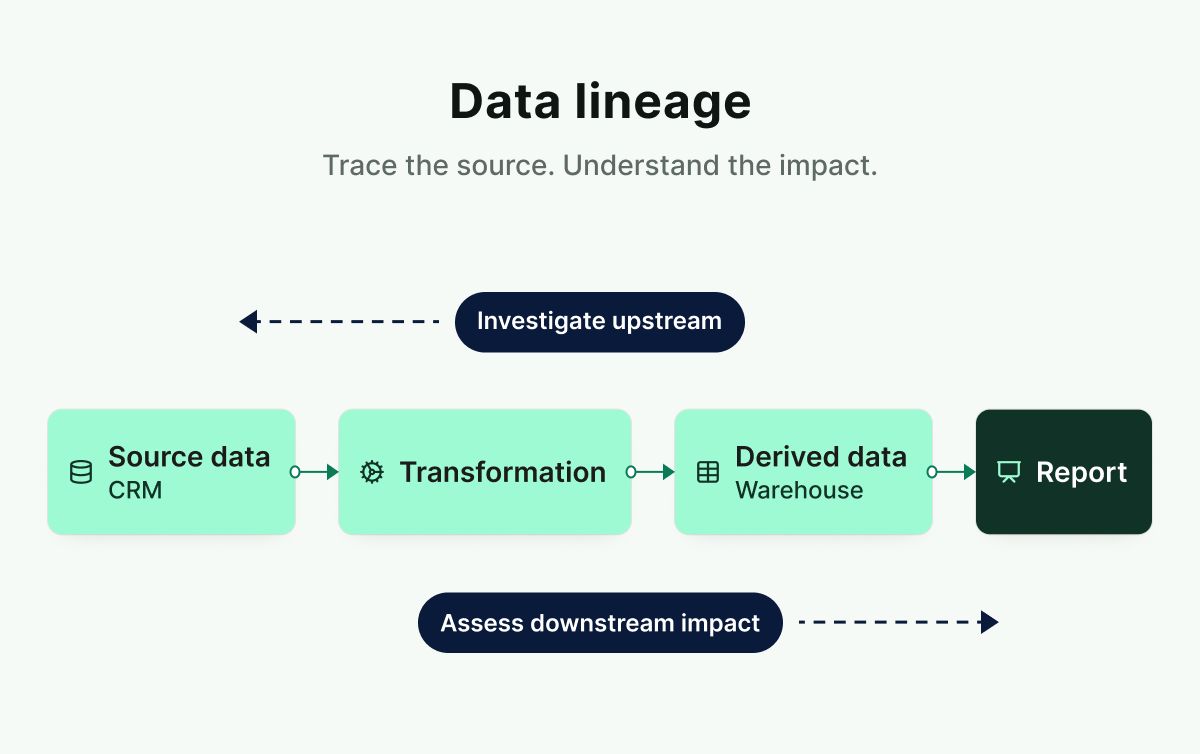
🔸 Build the logic once, in the data model. Put measures in a certified semantic model instead of re-creating them in every report. Reports then consume the definition rather than reinvent it.
🔸 Version your changes. When a definition changes (for example, revenue now excludes intercompany), document it and flag the break in trend lines so nobody compares apples with oranges.
🔸 Show the definition inside the report. A simple tooltip or info page with the formula builds trust faster than any visual.
✅ The result: shorter meetings, fewer "which number is right?" emails, and a finance team that spends its time on analysis instead of reconciliation.
For CFOs and finance teams across Belgium, the Netherlands, Germany, Luxembourg and France, the fastest win is often not a new tool. It is agreeing on the five to ten KPIs that really drive decisions, and defining them properly once.
How many different definitions of "revenue" exist in your organisation today? 👇
#Vizlake #Belgium #Brussels #PowerBI #KPI #DataGovernance